Need for Speed: How We Optimized Performance in the Joget Workflow v6 Platform
As an open source low-code / no-code application platform, Joget Workflow allows both non-coders and coders alike to visually build apps rapidly. Beneath this simplicity though, there is a lot going on and performance has always been a priority. The focus is to provide a fast runtime for apps, and we diligently try to ensure that there is as little overhead as possible at the platform level.
The Joget team has been hard at work on Joget Workflow v6, currently in public beta. We have recently been looking into ways to streamline and optimize performance of the platform even more.
This technical article details how this was done for the latest beta release, and could provide helpful tips for your own projects or products. The article gets quite technical and is targeted at developers interested in the inner workings of the platform. Let’s take a look under the hood.
Server-Side Code Profiling
The Joget platform is built on Java, so numerous code profiling tools are available just a Google search away. In our development environment, we used the Netbeans Profiler, a fully featured Java profiling tool integrated into the NetBeans IDE.
Back in 2014, we had already performed performance profiling for v4. Here’s a screenshot of hot spots uncovered during sampling then.
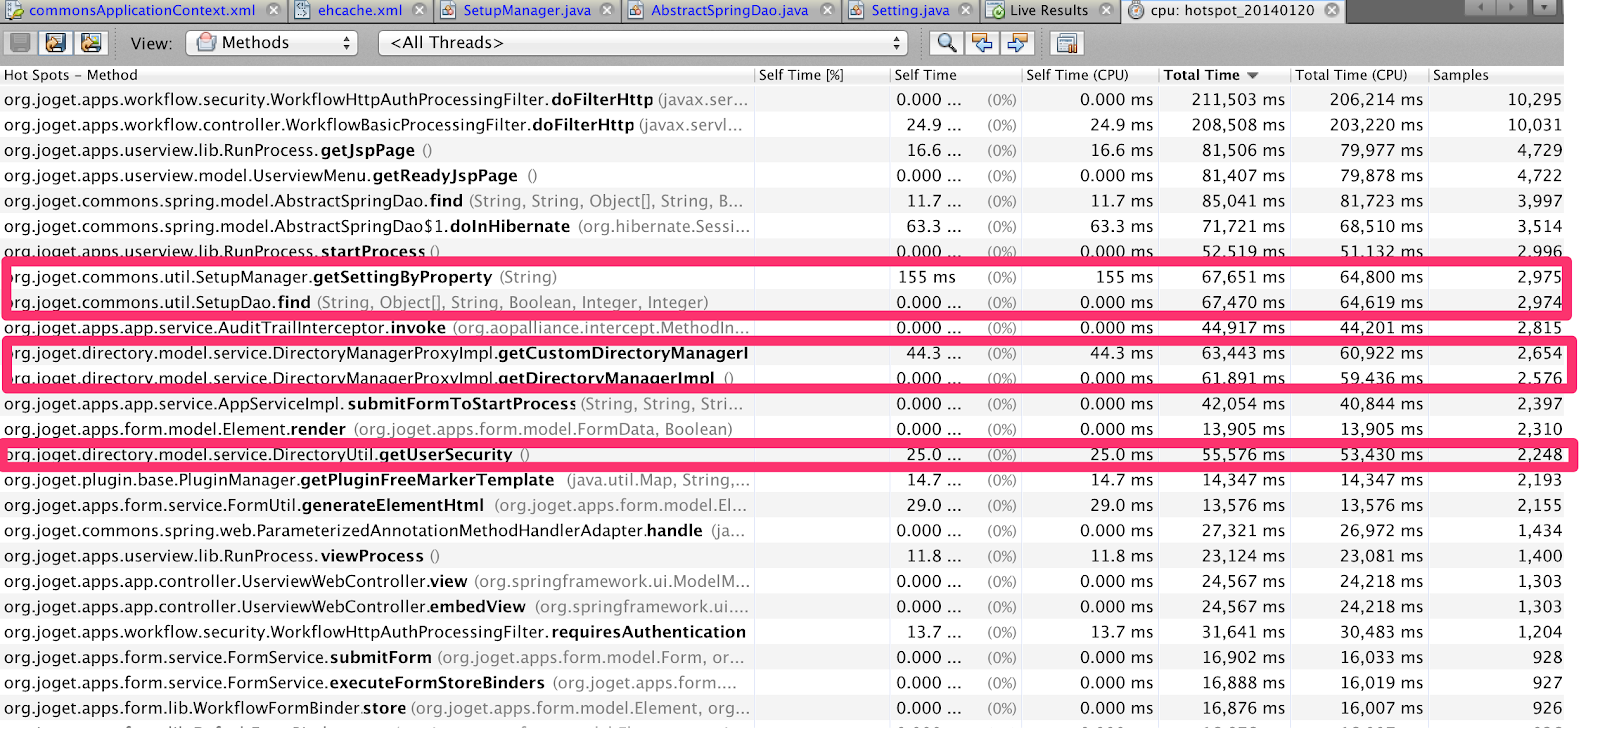 |
| v4 Snapshot Hot Spots |
All those prominent hot spots and bottlenecks have been removed since v4 through code optimization and appropriate caching.
In the latest v6 snapshot, we uncovered some additional hot spots in several controller methods that could be possible candidates for optimization.
In the latest v6 snapshot, we uncovered some additional hot spots in several controller methods that could be possible candidates for optimization.
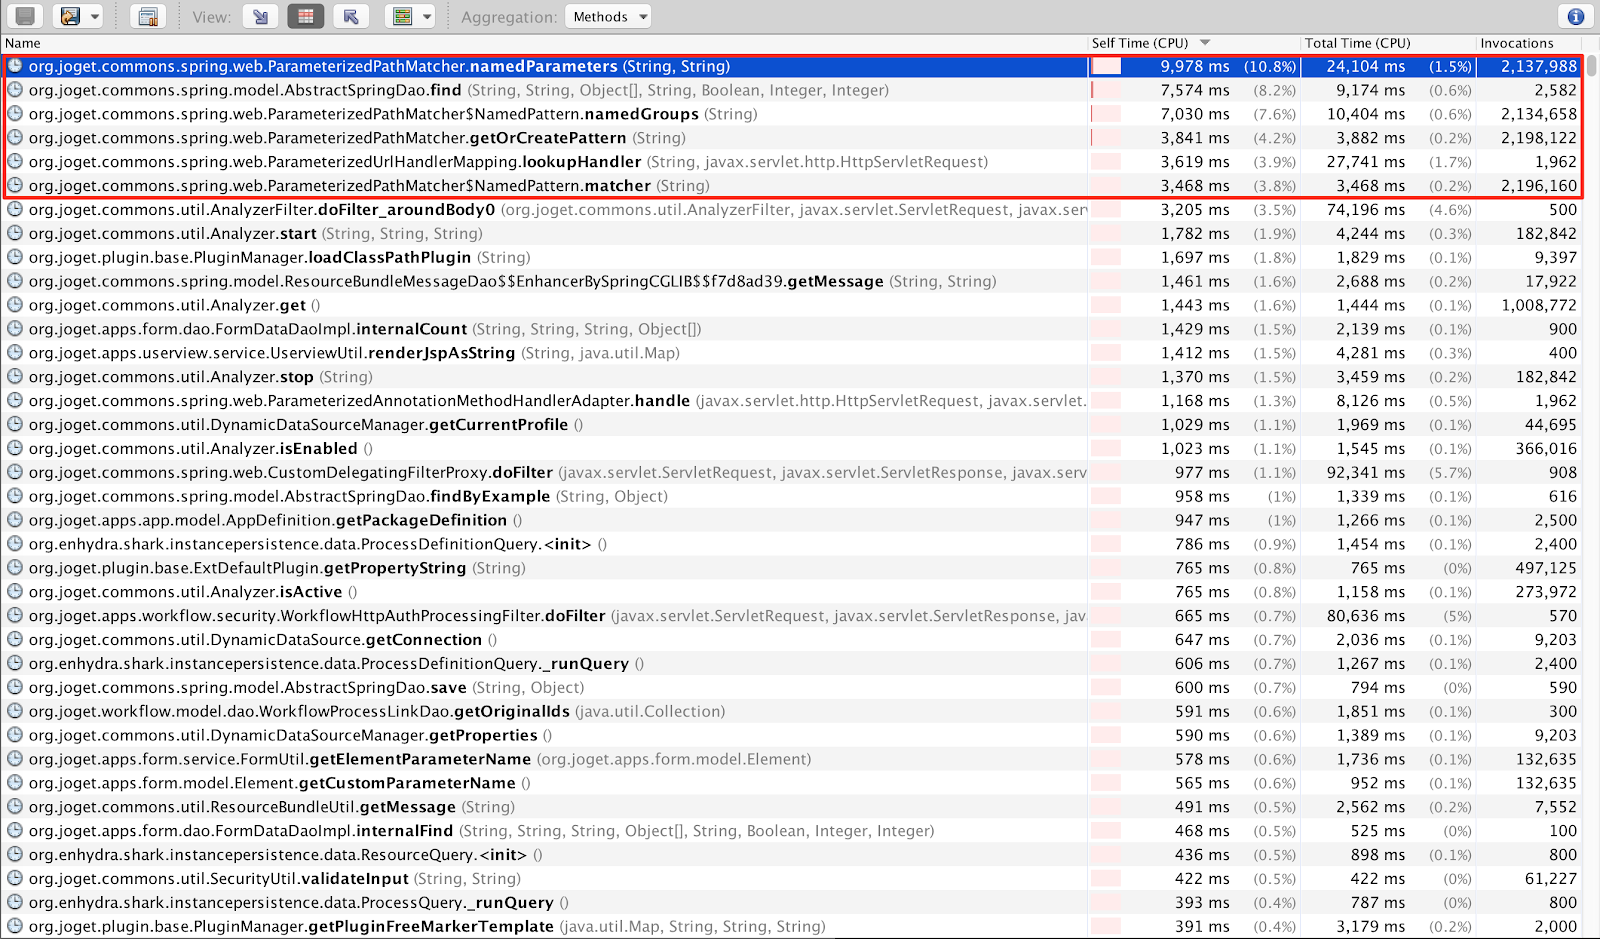 |
| v6 Snapshot Pre-Optimization Hot Spots |
The method calls are actually extremely fast, but it seems that there are many invocations so we decided to try to implement some refactoring and caching using the Ehcache library to reduce the amount of calls needed.
The post optimization results show great promise with all those invocations avoided, which should reduce CPU cycles under high load.
The post optimization results show great promise with all those invocations avoided, which should reduce CPU cycles under high load.
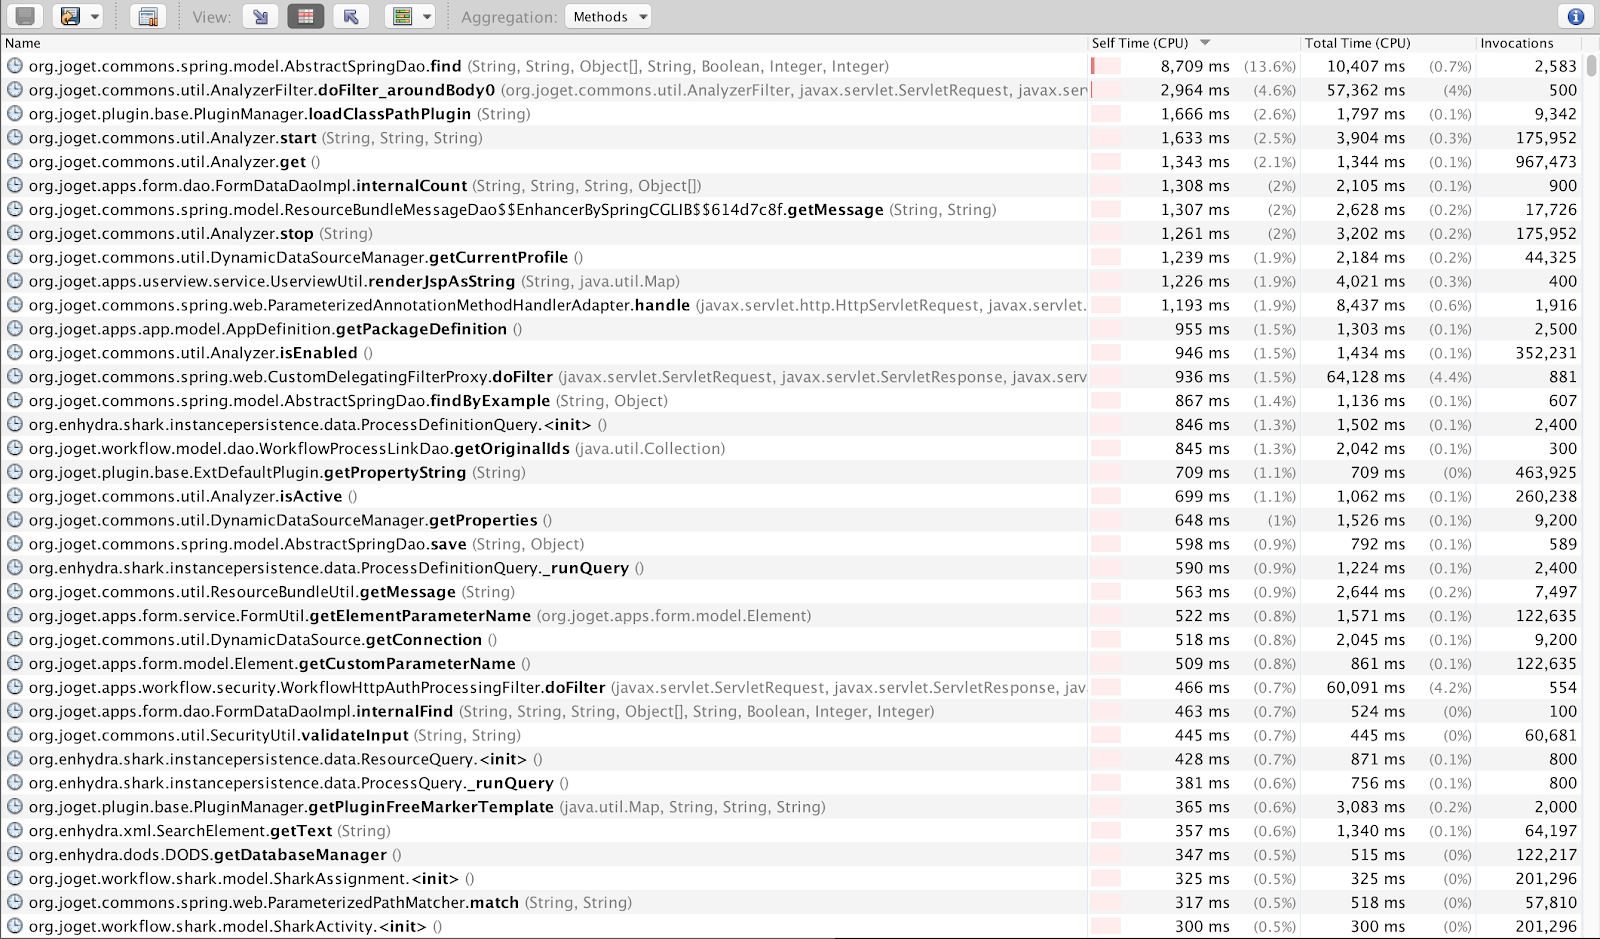 |
| v6 Snapshot Post-Optimization Hot Spots |
All avoidable server-side hot spots looks to have been eliminated, so next we moved on the client-side browser rendering portion of performance.
Client-Side Browser Critical Rendering Path and Perceptual Speed Measurement
Using the new Google Chrome Audits panel powered by Lighthouse introduced in Chrome 60, we ran a set of tests to measure the quality of the Joget apps using the latest Material design inspired v6 Universal Theme.Here’s the audit result before we started the optimization:
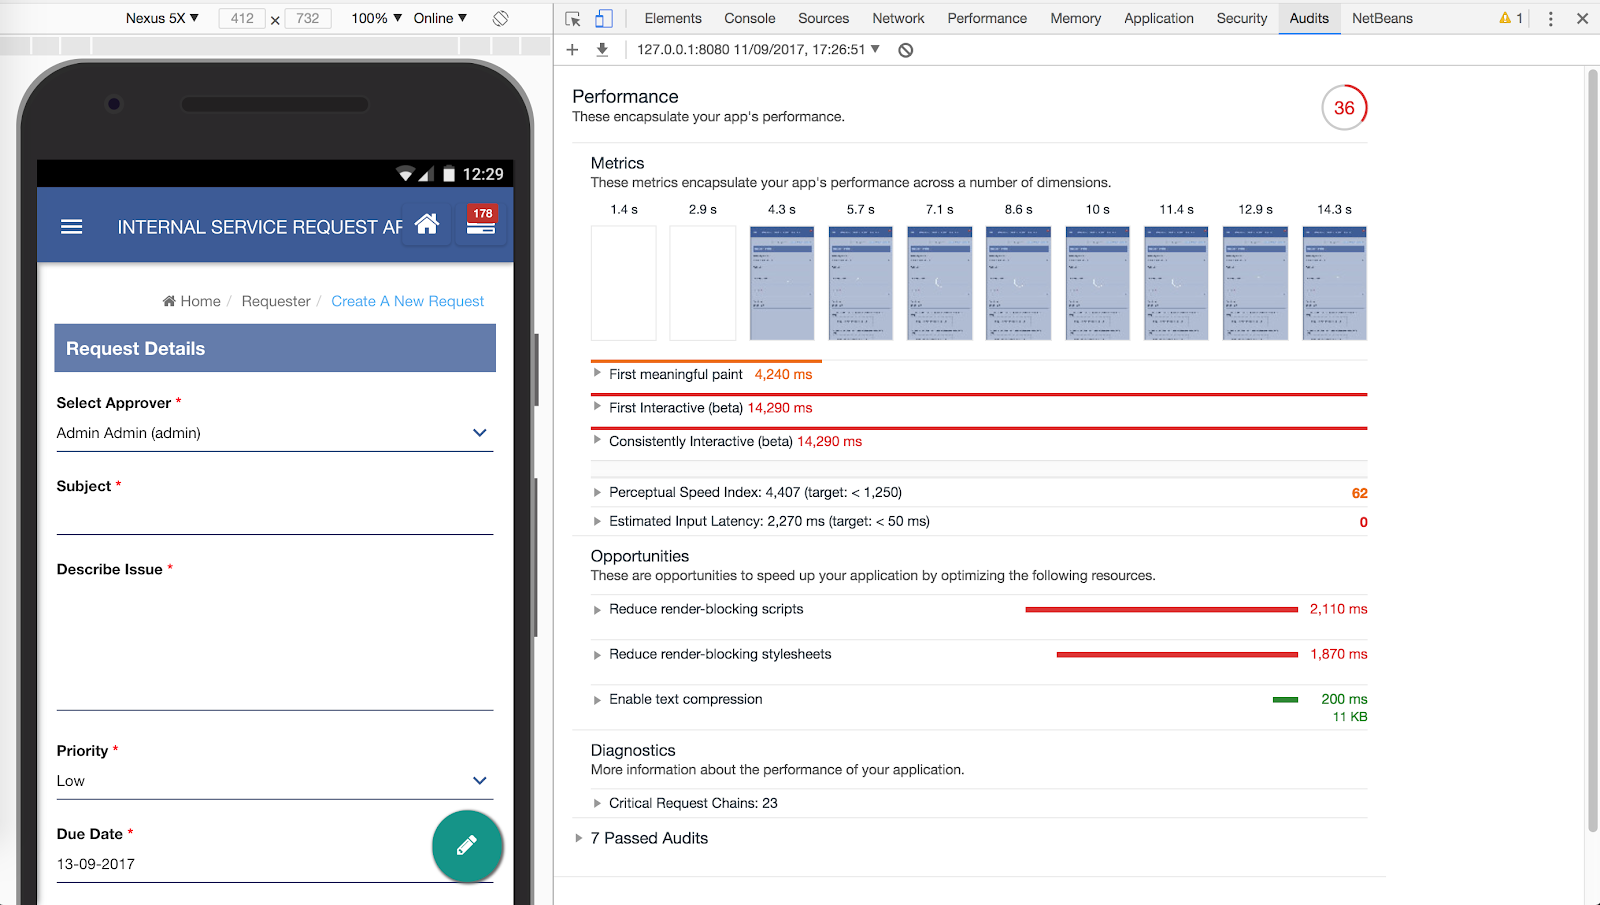 |
| Pre-Optimization Performance Audit |
The performance score was a lowly 36, with slow perceptual speed for the user who only sees the first meaningful paint of the UI after 4 seconds. Ouch! Why was this happening?
Using the Chrome DevTools Performance Analysis, we discovered that the critical rendering path was unoptimized. This simply means that the browser has to do a lot of work like loading and parsing the HTML, scripts and CSS before it’s able to render something to the user.
Using the Chrome DevTools Performance Analysis, we discovered that the critical rendering path was unoptimized. This simply means that the browser has to do a lot of work like loading and parsing the HTML, scripts and CSS before it’s able to render something to the user.
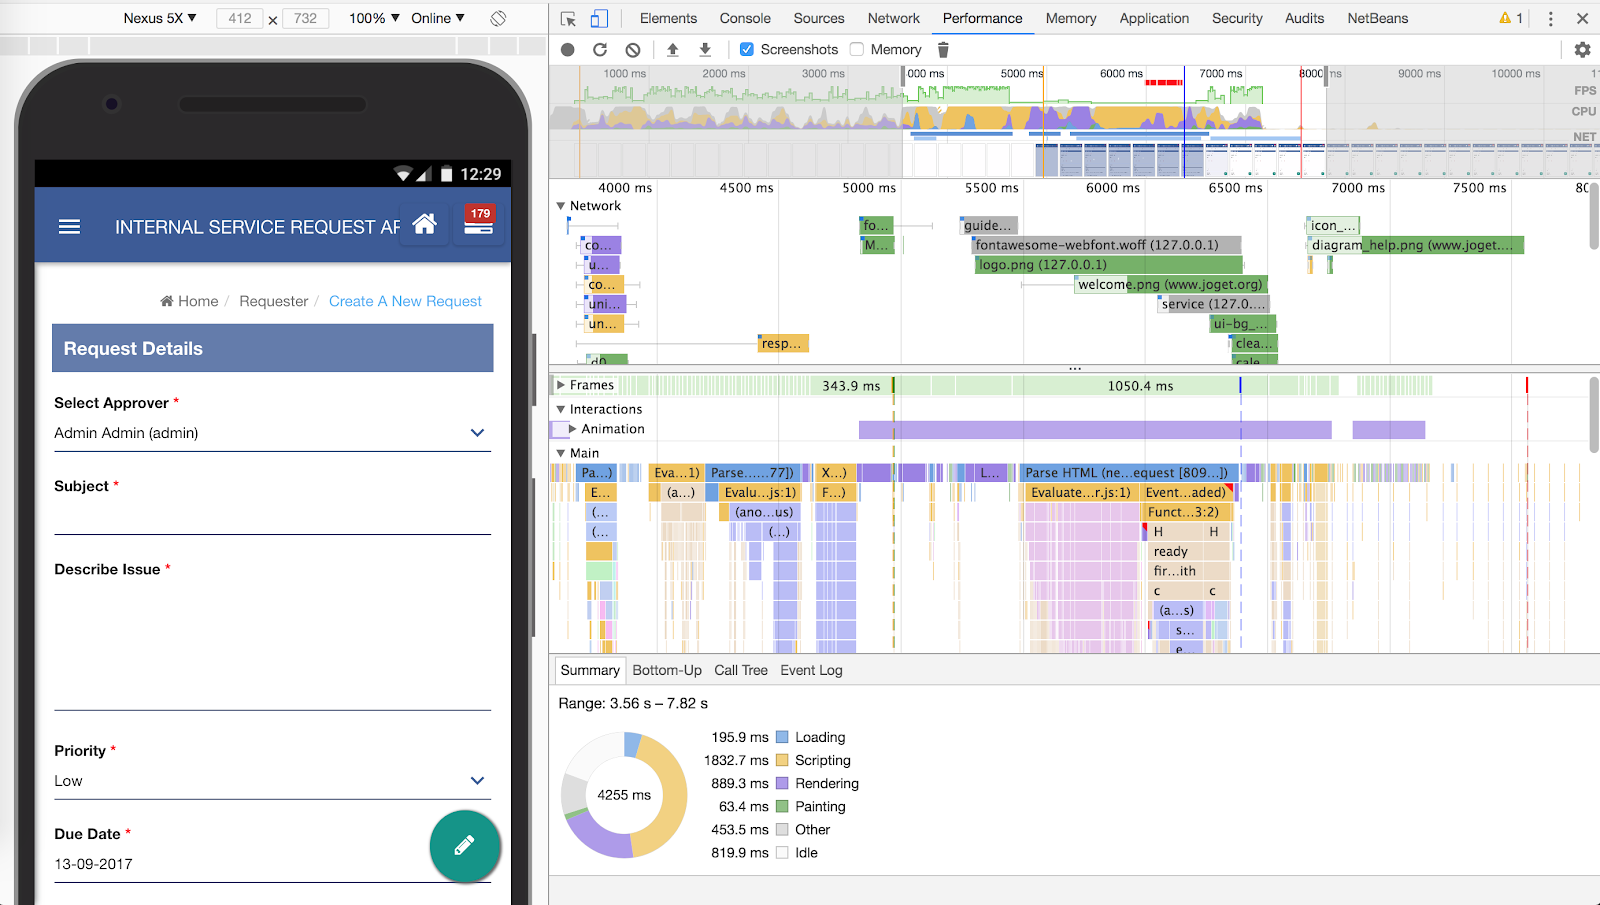 |
| Pre-Optimization Performance Analysis |
- There is a client-side AJAX request to process a LESS CSS file, and
- There was blocking while the browser needed to load all resource files (scripts, CSS, etc) before being able to perform a first meaningful paint.
- There were some blocking JavaScript functions during the onload and document ready events.
Having identified these issues, we got to work addressing them:
- The LESS CSS processing was moved server-side using the LESS Engine and cached.
- We removed unnecessary blocking of resource loading by making use of asynchronous loading of scripts as well as CSS.
- Non-critical JavaScript functions called during the onload and document ready events were modified to be called asynchronously using setTimeout.
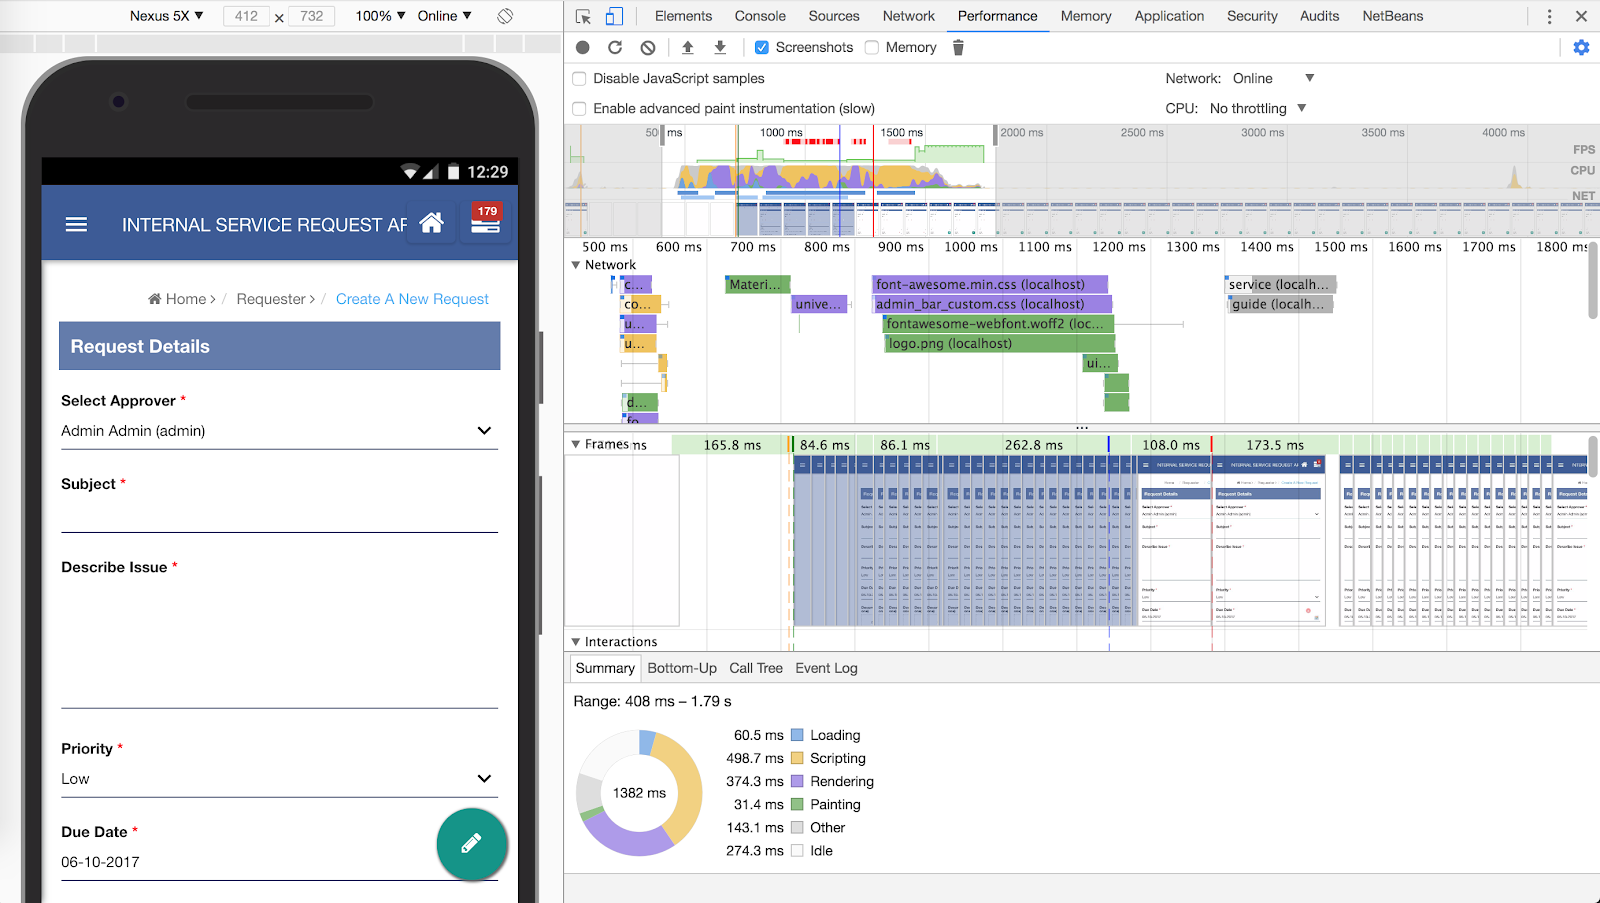 |
| Post-Optimization Performance Analysis |
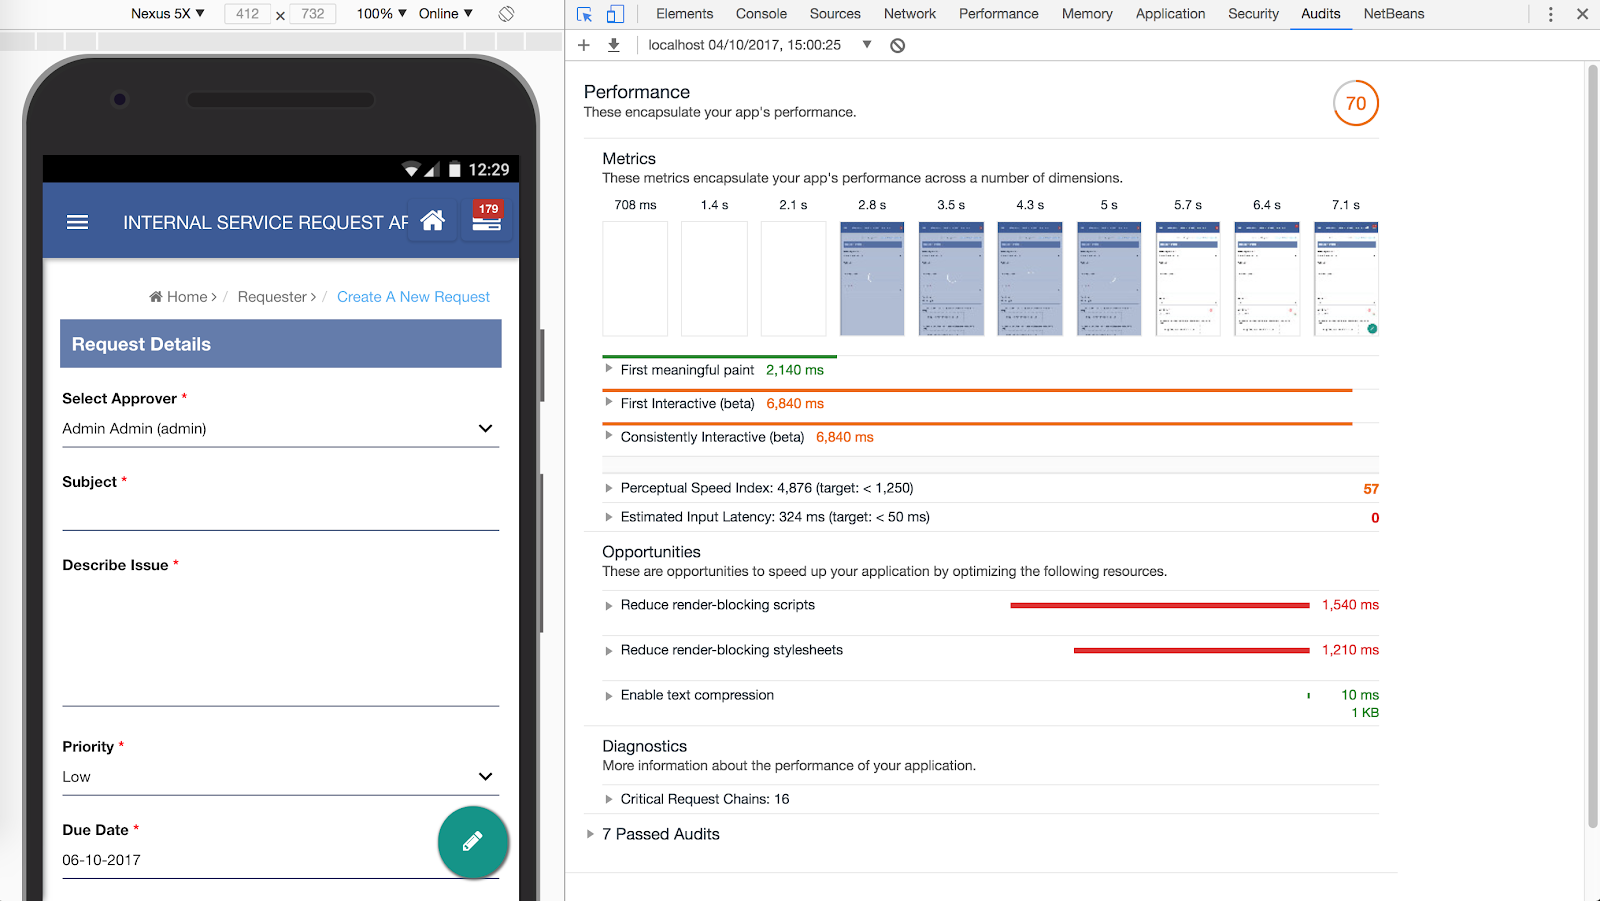 |
| Post-Optimization Performance Audit |
So, What Were The Optimization Results?
We ran a load test using Apache JMeter to compare the performance of the current stable version of Joget Workflow v5 against a latest build of the optimized v6 code. Running on Apache Tomcat 8.5.16 against a mixed use case test app, there was a 26.2% improvement in throughput (requests per second) so it looks like the optimizations paid off. If it doesn’t sound like much, that’s probably because the previous versions are already pretty well optimized, and this latest optimization effort squeezes out the remaining ounces of inefficiencies.
Version
|
Throughput (req/s)
|
Improvement
|
v5.0.16 on Tomcat 8.5
|
35.73
| |
v6.0-SNAPSHOT on Tomcat 8.5
|
45.10
|
26.20%
|
 |
| Throughput Comparison |
What’s Next
With emphasis on performance optimization at the platform level, Joget Workflow incurs low overhead when running apps. This has been the case since v4, and has even been improved upon for the upcoming v6.If there are any specific bottlenecks, it would usually be at the application level. At the application level, there are various guidelines and best practices that are available in the Performance Optimization and Scalability Tips article in the Joget Workflow Knowledge Base. v6 also provides the Performance Analyzer, and introduces easy to use caching capabilities as described in Performance Improvement with Userview Caching.
To learn more and get started with Joget Workflow, visit https://www.joget.org


Comments
Post a Comment